I hope everyone is doing well and keeping healthy as this holiday season quickly approaches us! We’re back with another Toronto Real Estate Market Update. I’m Britt Huggins, a Toronto real estate agent on the SO&Co. team and it’s time to take a look at the November stats as we near the end of 2022.
As most of you know, interest rates have increased multiple times since March 2022, 7 times to be exact. In fact, the Bank of Canada announced another increase of 50 points to 4.25% last week. As borrowing costs rise, transactions move in the opposite direction, declining by 50% across the GTA when compared to this time last year. The number of homes on the market has increased; inventory is up by 96% when compared to this time last with nearly 12,000 properties available for sale. There are about 2.5 months worth of inventory for sale, which interestingly enough is still considered a Seller’s Market. In order to be considered a Buyer’s Market, we would need to see closer to four or more months’ worth of inventory.
Condominium sales (transactions) are down 55% when compared to November 2021. While condos are much more affordable than freehold properties, prices are more consistent, not much movement is happening.
Let’s break down the stats by our most popular regional real estate markets: the GTA, Toronto, Mississauga, Oakville, Durham Region, and Brampton. Please note, the stats below are based on real estate sold year to date. For those who aren’t familiar with what year-to-date means, it is the total of something from the first day of the year through the current date.
GTA Real Estate Market Stats
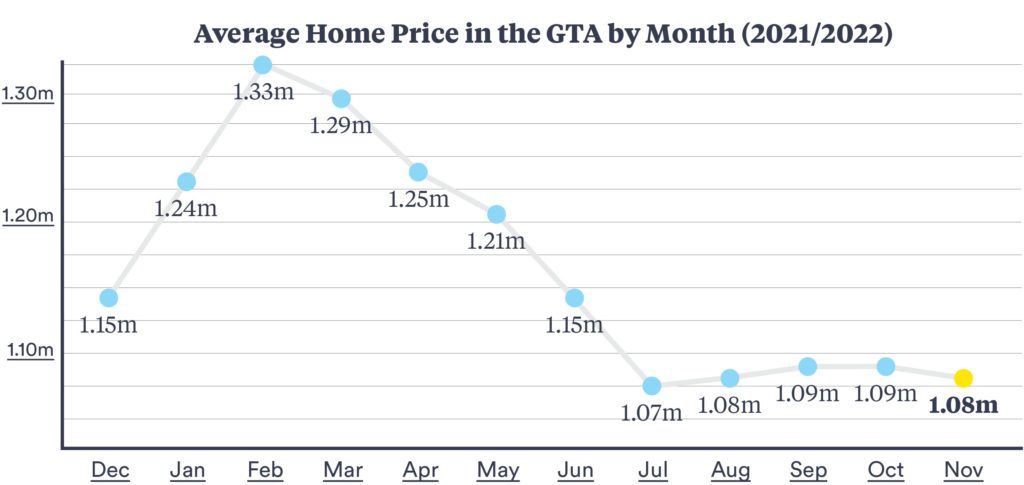
When looking at all home types in November 2022, the average sale price in the GTA was up 9.5%% to $1,195,945 year to date, when compared to November 2021. When zooming in on condos, prices were down 0.9% to $708,636 year to date, when compared to this time last year.
Toronto Real Estate Market Stats
When looking at all home types in November 2022, the average sale price in Toronto was up 8.2% to $1,145,933 year to date, when compared to November 2021. When zooming in on condos, prices were down 1.5% to $734,797 year to date, when compared to this time last year.
Mississauga Real Estate Market Stats
When looking at all home types in November 2022, the average sale price in Mississauga was up 11.1% to $1,123,070 year to date, when compared to November 2021. When zooming in on condos, prices were down 2.8% to $600,605 year to date, when compared to this time last year.
Oakville Real Estate Market Stats
When looking at all home types in November 2022, the average sale price in Oakville was up 10.2% to $1,630,061 year to date, when compared to November 2021. When zooming in on condos, prices were up 0.4% to $718,708 year to date, when compared to this time last year.
Durham Region Real Estate Market Stats
When looking at all home types in November 2022, the average sale price in the Durham Region was up 11.9% to $1,030,538 year to date, when compared to November 2021. When zooming in on condos, prices were up 1.3% to $556,599 year to date, when compared to this time last year.
Brampton Real Estate Market Stats
When looking at all home types in November 2022, the average sale price in Brampton was up 14.3% to $1,178,953 year to date, when compared to November 2021. When zooming in on condos, prices were down 3.7% to $529,850 year to date, when compared to this time last year.
We know these numbers can be confusing. As always, we are here to assist you with all your real estate needs, feel free to reach out and one of our real estate experts will get back to you!